
How to Explain the 2026 Housing Market to Nervous Clients
Use current national and regional data, plus practical talk tracks, to explain the 2026 housing market to nervous buyers and sellers.
By Rajwinder Mahal
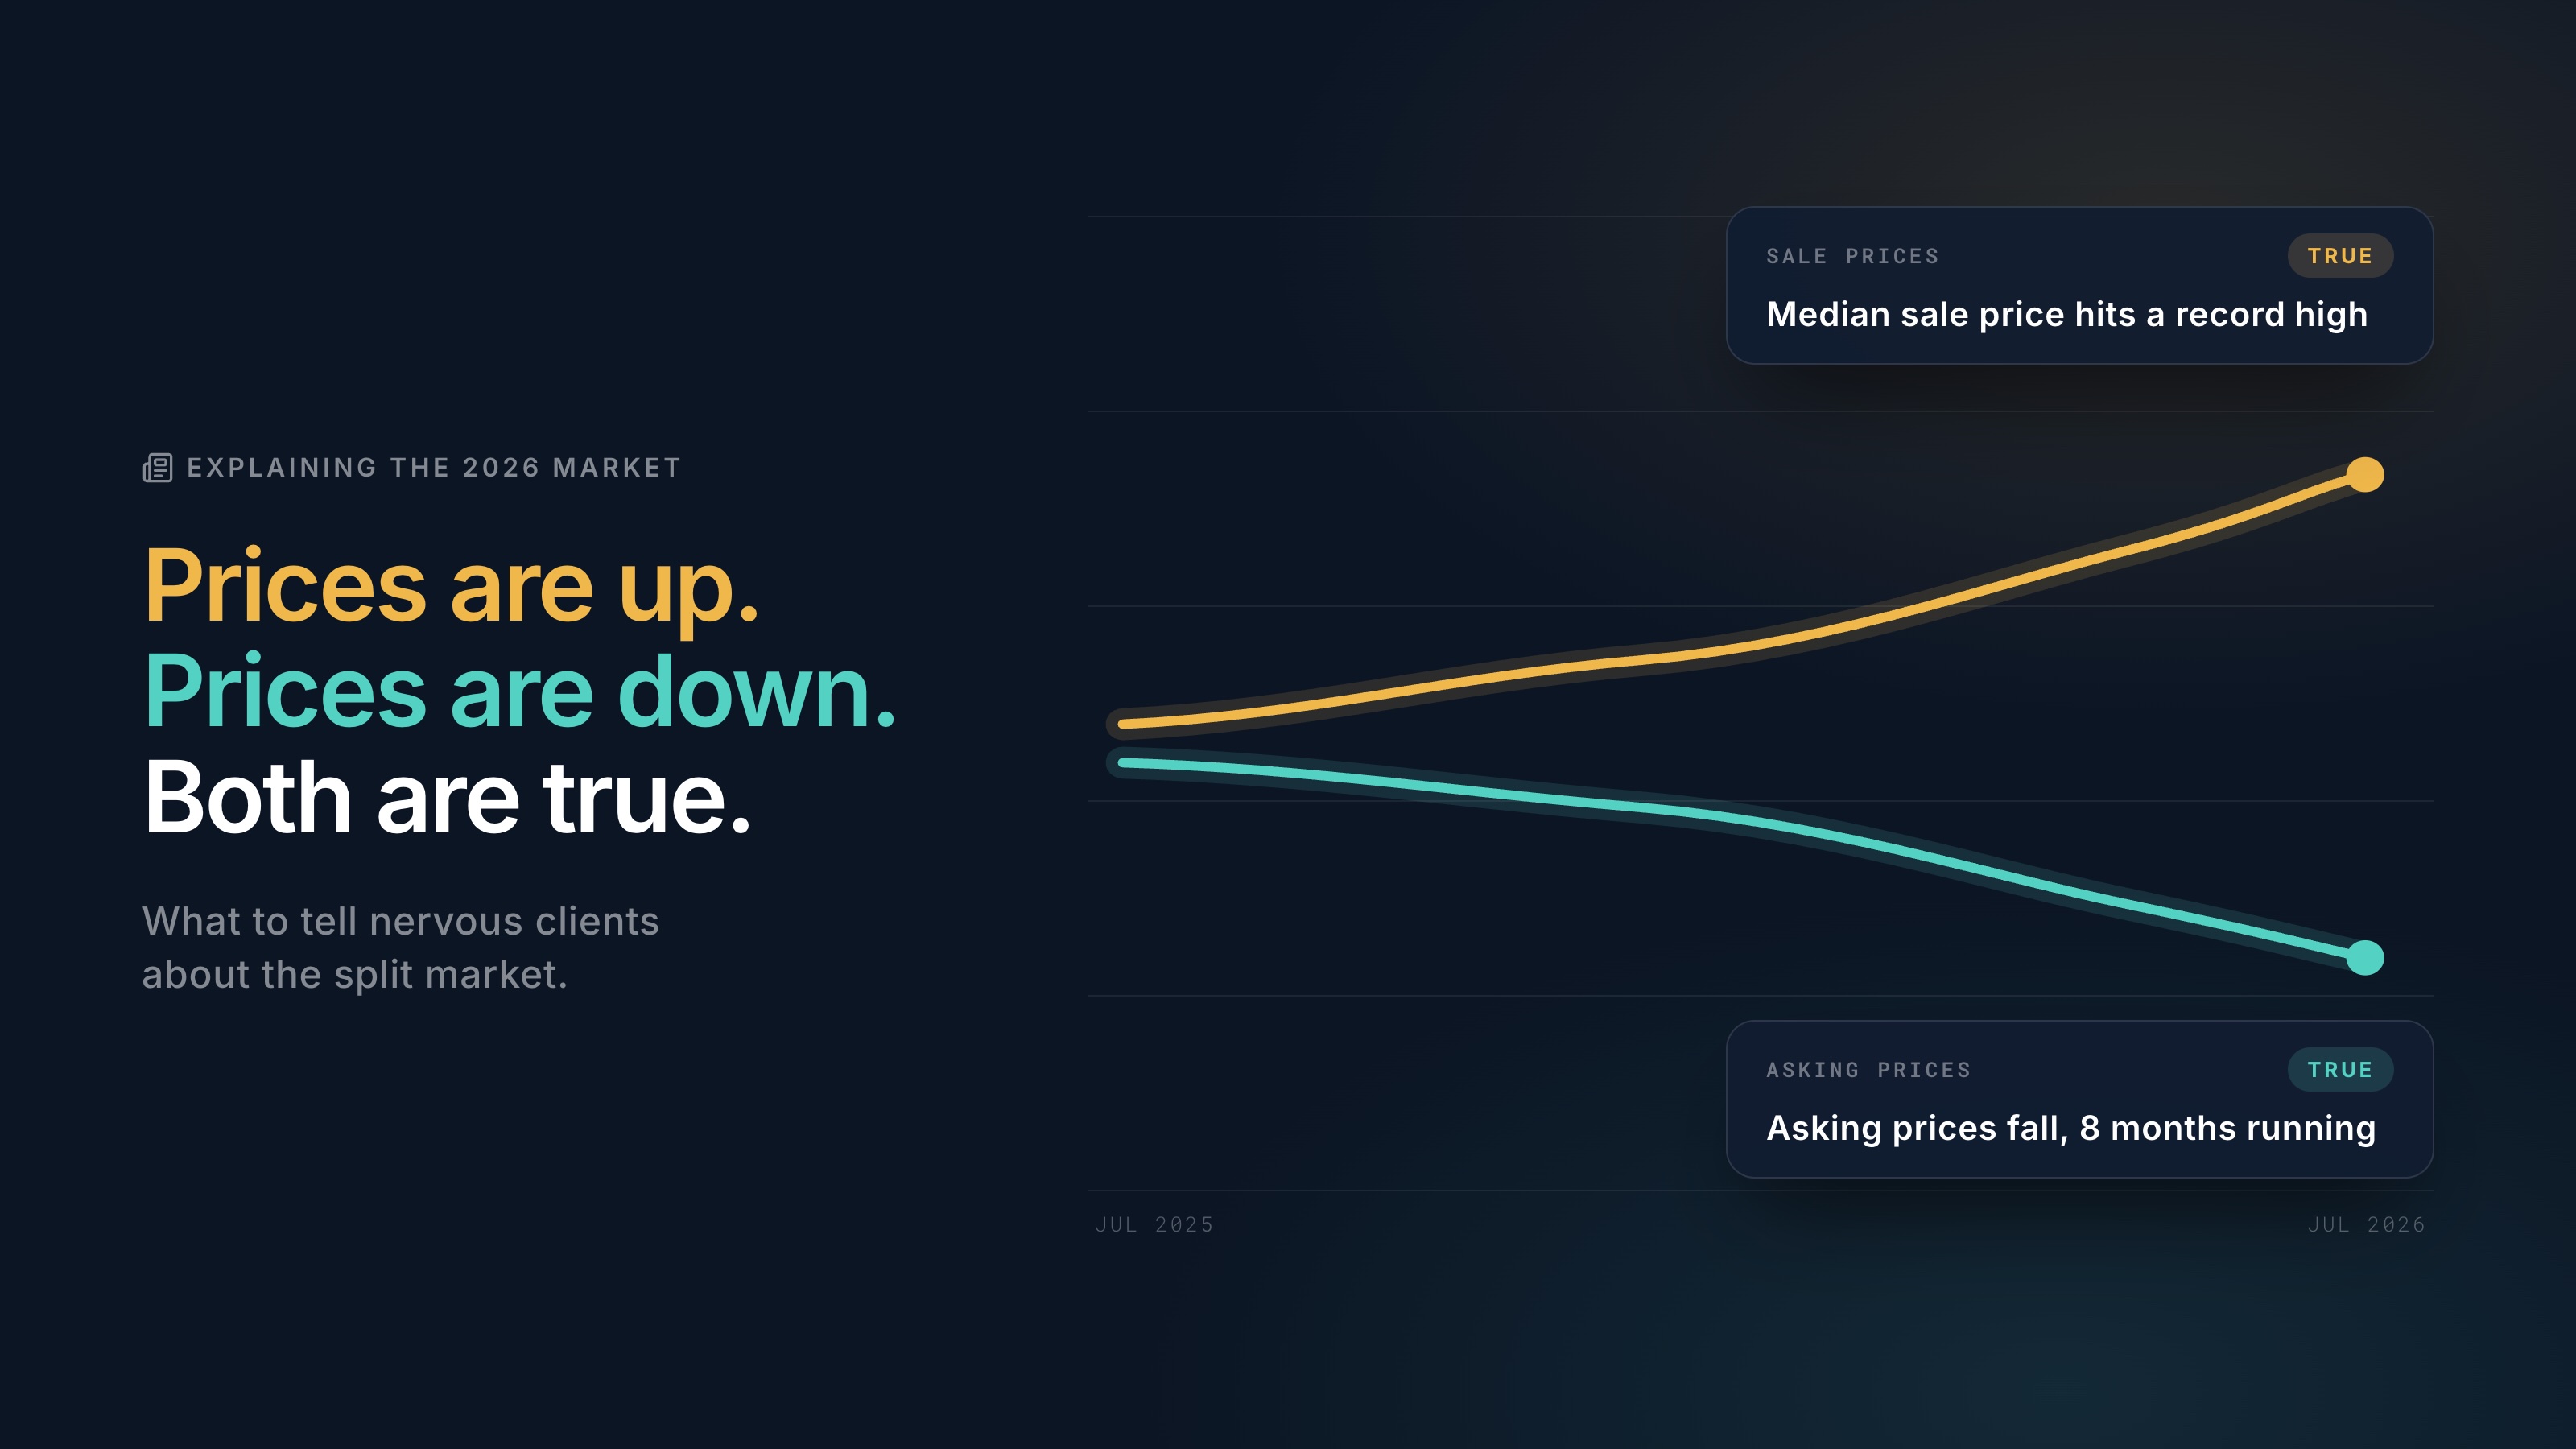
Your clients may have seen headlines like the national median sale price reached a record high, while median asking prices fell for an eighth straight month. Both can be true, but the distinction is easy to miss. This guide uses data available in July 2026 to explain the difference, show how conditions vary by region and metro, and give you practical talk tracks for nervous buyers and sellers. Recheck every figure before sharing it with a client.
What is actually happening in the 2026 housing market?
The short version to say out loud: sales are recovering gradually, national sale prices are modestly higher, mortgage rates were in the mid-6s in July, and buyers have more homes to choose from, though inventory remains below pre-pandemic norms. NAR's mid-June 2026 update projects existing-home sales and the median price each up 4% for the year, with mortgage rates averaging 6.5%. NAR Chief Economist Lawrence Yun expects the second half to be modestly better than the first. That forecast describes a market improving slowly, not moving toward either extreme.
The July 2026 readings support that view. Redfin's June data put sales at a seasonally adjusted annual rate of about 4.4 million, the highest since 2022, with the median sale price at a record $408,776, up 2.2% year over year, and 3.7 months of supply. Realtor.com's June report counted about 1.1 million active listings, up 1.9% from a year earlier but still 11.3% below typical pre-pandemic levels. Pending sales rose 3.7% for a seventh straight month. The Freddie Mac 30-year rate averaged 6.49% in the second week of July. These numbers move monthly, so pull the latest figures before quoting them. As of July, they pointed to a modest recovery, gradually improving supply, and mortgage rates near the mid-6s.
Why do the headlines contradict each other?
Because they measure different parts of the market. Three distinctions turn the conflicting headlines into one coherent story:
Sale prices versus list prices. Redfin's record median, up 2.2%, tracks what homes actually sold for. Realtor.com's decline, with asking prices down 2.5% year over year in June for an eighth consecutive month, tracks what sellers are asking. Sellers are repricing while the mix of homes that sell skews expensive. As Redfin's head of economics research, Chen Zhao, put it in July, "High-end buyers are driving demand and prices in much of the country." When the sold mix tilts toward higher-priced homes, the median sale price can reach a record even as typical asking prices fall.
Activity versus price. As Realtor.com Chief Economist Danielle Hale summarized the June data: "Eight straight months of falling prices and seven straight months of rising pending sales are not a contradiction." More realistic asking prices can help bring buyers back. Falling list prices and rising pending sales are two sides of the same rebalancing.
National versus local. Every national number averages together markets moving in different directions. That is why your local data matters more than the national headline.
What does the regional split actually look like?
The regional numbers show a clear split. In Realtor.com's June figures, active inventory rose 8.5% year over year in the Northeast and 7.3% in the Midwest, while the South (-0.1%) and West (+0.3%) were roughly flat. Asking prices were flat in the Midwest and down 1.0% in the Northeast, compared with declines of 2.5% in the South and 4.0% in the West. Realtor.com senior economist Jake Krimmel called it "the two Americas story in housing," four years in the making.
But metros do not always follow their region. In Redfin's June metro data, the biggest sale-price gains included San Francisco (+9.2%) and West Palm Beach (+8.6%), both driven in part by luxury sales, alongside Pittsburgh (+9.1%). Seattle (-4.9%), San Jose (-3.9%), and Portland (-1.8%) posted the biggest declines. NAR Deputy Chief Economist Jessica Lautz captured the unevenness: "You'll list a home on the market, and sometimes it'll sit for months. And sometimes it's going to have multiple offers." National headlines may shape a client's expectations, but local comps should shape the strategy.
What do you tell a nervous seller?
Start with their position, then reset the reference point. NAR's forecast projects that the typical homeowner will gain about $16,000 in housing wealth this year. A seller may still feel disappointed if they are comparing today's conditions with the unusually competitive market of 2021. Bring the conversation back to their equity, timeline, and recent local sales. The talk track:
"Homes here are selling. I'll show you exactly what has sold within a half mile in the last 90 days and how long each home took. Buyers have more options now, so pricing and preparation affect the response we get. Pricing to recent sales gives us a better chance of strong early interest; pricing to 2021 expectations raises the risk of sitting on the market and cutting later. I'd rather set the price from current evidence."
Use the regional figures as context, then replace them with local data. In parts of the South and West, you might say: "Asking prices across our region are down from last year, so overpricing carries more risk. Let's look at what buyers are paying in this neighborhood." In parts of the Midwest and Northeast: "Inventory has increased, but asking prices have held up better. Let's see whether that pattern is true for homes like yours." Either way, bring recent sold comps, average days on market, and a specific preparation plan. Concrete evidence usually helps more than broad reassurance.
What do you tell a hesitant buyer?
Skip the rate prediction and focus on the choices available now. NAR projects mortgage rates averaging 6.5% in 2026, but nobody can promise a better rate next year. Buyers did have more listings to choose from in June, more asking-price flexibility, and, for the first time in 26 months, a median time on market that was unchanged from a year earlier, according to Realtor.com. The talk track:
"I can't predict rates, and I won't pretend to. Here's what we can evaluate today: you have more choices than buyers have had in recent years, asking prices have softened in many markets, and some sellers are more open to negotiation. We'll look at credits, repairs, and closing costs property by property. If the payment works at today's rate on a home you want, we can make a decision using facts we know. If rates fall later and you qualify, refinancing may be an option, but it shouldn't be the plan."
Two guardrails matter. Leave the affordability analysis to a qualified lender, and put the terms of the working relationship in writing at the start. Our buyer agency agreement guide can help with that conversation. None of this is financial advice; it is market context for a decision that belongs to the client.
What about the owner locked in at 3%?
Name the lock-in honestly, then look at the full cost of each option. Swapping a 3% mortgage for one in the mid-6s can raise the monthly payment substantially. But the rate is one part of a larger decision that includes current equity, the price of the next home, moving costs, and how long the owner expects to stay in a home that no longer fits. The talk track:
"You're right that your rate is hard to give up. The real question is what the next five years cost in each scenario. If you're moving to a market where prices have softened, the purchase price of the next home may offset part of the higher financing cost, and your current equity may give you room to work with. Let's run both versions with real numbers. Sometimes waiting is the better option, and I'll tell you if it is."
Be willing to conclude that moving now does not make sense. Honest advice can build the long-term trust that brings the client back when the timing changes and supports future referrals.
How do you turn the explainer into marketing content?
Turn one clear explanation into several pieces of content for your marketing plan. Your monthly newsletter can explain "the two headlines that are both true," using local numbers to translate the national story. A 30-second Reel can cover the same sale-price-versus-list-price distinction and end with what it means in your market. Use those figures again at open houses and in client conversations. Clients do not need another prediction; they need current, sourced context for their decision. Refresh the numbers each quarter, or sooner when conditions change.
Frequently asked questions
Data in this post is as of July 2026 and will be refreshed; each source below publishes updated figures monthly or weekly. Market conditions vary block by block, so treat everything here as context rather than advice for a specific transaction.